mirror of
https://github.com/go-gitea/gitea.git
synced 2024-11-25 16:20:27 +01:00
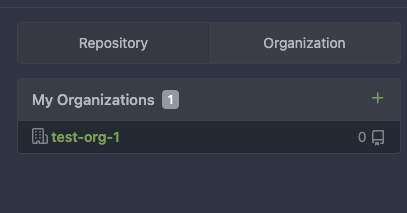
Similar to #23394 The dashboard repo list mixes jQuery/Fomantic UI/Vue together, it's very diffcult to maintain and causes unfixable a11y problems. This PR uses two steps to refactor the repo list: 1. move `data-` attributes to JS object and use Vue data as much as possibled3adc0dcac2. move the code into a Vue SFC7ebe55df6eTotal: +516 −585 Screenshots: <details>    </details> --------- Co-authored-by: John Olheiser <john.olheiser@gmail.com>
113 lines
2.9 KiB
Vue
113 lines
2.9 KiB
Vue
<template>
|
|
<div>
|
|
<div class="activity-bar-graph" ref="style" style="width: 0; height: 0;"/>
|
|
<div class="activity-bar-graph-alt" ref="altStyle" style="width: 0; height: 0;"/>
|
|
<vue-bar-graph
|
|
:points="graphPoints"
|
|
:show-x-axis="true"
|
|
:show-y-axis="false"
|
|
:show-values="true"
|
|
:width="graphWidth"
|
|
:bar-color="colors.barColor"
|
|
:text-color="colors.textColor"
|
|
:text-alt-color="colors.textAltColor"
|
|
:height="100"
|
|
:label-height="20"
|
|
>
|
|
<template #label="opt">
|
|
<g v-for="(author, idx) in graphAuthors" :key="author.position">
|
|
<a
|
|
v-if="opt.bar.index === idx && author.home_link"
|
|
:href="author.home_link"
|
|
>
|
|
<image
|
|
:x="`${opt.bar.midPoint - 10}px`"
|
|
:y="`${opt.bar.yLabel}px`"
|
|
height="20"
|
|
width="20"
|
|
:href="author.avatar_link"
|
|
/>
|
|
</a>
|
|
<image
|
|
v-else-if="opt.bar.index === idx"
|
|
:x="`${opt.bar.midPoint - 10}px`"
|
|
:y="`${opt.bar.yLabel}px`"
|
|
height="20"
|
|
width="20"
|
|
:href="author.avatar_link"
|
|
/>
|
|
</g>
|
|
</template>
|
|
<template #title="opt">
|
|
<tspan v-for="(author, idx) in graphAuthors" :key="author.position">
|
|
<tspan v-if="opt.bar.index === idx">
|
|
{{ author.name }}
|
|
</tspan>
|
|
</tspan>
|
|
</template>
|
|
</vue-bar-graph>
|
|
</div>
|
|
</template>
|
|
|
|
<script>
|
|
import VueBarGraph from 'vue-bar-graph';
|
|
import {createApp} from 'vue';
|
|
|
|
const sfc = {
|
|
components: {VueBarGraph},
|
|
data: () => ({
|
|
colors: {
|
|
barColor: 'green',
|
|
textColor: 'black',
|
|
textAltColor: 'white',
|
|
},
|
|
|
|
// possible keys:
|
|
// * avatar_link: (...)
|
|
// * commits: (...)
|
|
// * home_link: (...)
|
|
// * login: (...)
|
|
// * name: (...)
|
|
activityTopAuthors: window.config.pageData.repoActivityTopAuthors || [],
|
|
}),
|
|
computed: {
|
|
graphPoints() {
|
|
return this.activityTopAuthors.map((item) => {
|
|
return {
|
|
value: item.commits,
|
|
label: item.name,
|
|
};
|
|
});
|
|
},
|
|
graphAuthors() {
|
|
return this.activityTopAuthors.map((item, idx) => {
|
|
return {
|
|
position: idx + 1,
|
|
...item,
|
|
};
|
|
});
|
|
},
|
|
graphWidth() {
|
|
return this.activityTopAuthors.length * 40;
|
|
},
|
|
},
|
|
mounted() {
|
|
const refStyle = window.getComputedStyle(this.$refs.style);
|
|
const refAltStyle = window.getComputedStyle(this.$refs.altStyle);
|
|
|
|
this.colors.barColor = refStyle.backgroundColor;
|
|
this.colors.textColor = refStyle.color;
|
|
this.colors.textAltColor = refAltStyle.color;
|
|
}
|
|
};
|
|
|
|
export function initRepoActivityTopAuthorsChart() {
|
|
const el = document.getElementById('repo-activity-top-authors-chart');
|
|
if (el) {
|
|
createApp(sfc).mount(el);
|
|
}
|
|
}
|
|
|
|
export default sfc; // activate the IDE's Vue plugin
|
|
</script>
|